Part 02

We have all known since our school days that the holy Ganga is the national river. But many of us are still ignorant about its plight. This article portrays a detailed canvas of a crying river in context to its pollution and future threats. Finally, it contours what can be done to mitigate the effects of imminent and impending danger.
So far in part 1 we have understood why Ganga is such a special river and how it has become so miserable. In this part we will look at the possible remedies.
River diagnosis
We can realize that the Ganga is severely unhealthy. But how to differentiate an unhealthy river from a healthy one?
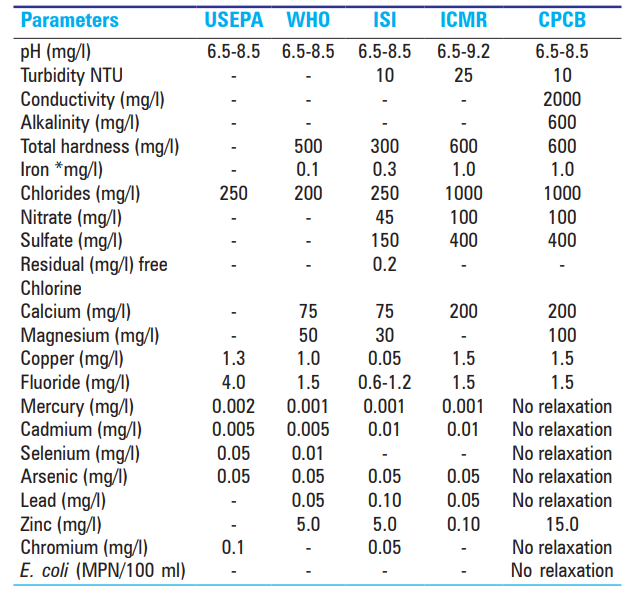
Statisticians and Chemists came up with many standardized parameters that determine river health. The water quality index (WQI), initially developed by Horton in 1965, is one of the most effective ways to describe the quality or status of water to date[i]. It uses several parameters like Dissolved oxygen (DO), Biological Oxygen Demand (BOD), pH, coliforms, specific conductance, alkalinity, and chlorides to determine water quality.
Horton model classifies water quality into five broad categories based on the score. A sample of water is considered Very good if the WQI score is within 91-100; Good (71 – 90); Poor (51 – 70); Bad (31 – 50), and Very bad (0 – 30). Very good implies that the river quality is almost always as desired while Very bad means that the river quality is nearly impaired and far beyond desired limits.
Now let me quickly explain the other terms associated with river health. DO refers to the amount of dissolved oxygen present in water. It is measured in ppm or mg/L units. It varies with the temperature of the water, pollution load, the respiration rate of the aquatic species, and the rate of photosynthesis. High DO suggest that the water quality is good and sustains aquatic life. Healthy water should have DO ranging between 6.5 mg/l to 8 mg/L[ii].
BOD is the amount of oxygen consumed by microorganisms when they decompose organic matter in aerobic conditions under specific temperatures. The more polluted the water is, the higher the BOD value. It is also measured in mg/L units. For drinking water, BOD has to be less than 5 mg/L at 20 degrees Celsius[iii].
Chemical Oxygen Demand (COD) determines the amount of oxygen required for the chemical oxidation of organic matter in presence of an oxidant such as potassium dichromate under reflux conditions[iv]. Just like BOD, high COD values indicate more water contamination. Drinking water should have less than 250 mg/L of COD[v].
pH refers to the antilogarithmic concentration of hydronium ions in water. It measures the acidity or alkalinity of the water. The value of the pH range varies from 0 to 14 where below 7 is considered acidic and above is alkaline. Pure water is neutral as it has a pH value of 7. Fish and other aquatic life require a pH range of 6.0 to 9.0. According to CPCB, the safe range for drinking water should be between 6.5 to 8.5[vi].
Specific conductance is the ability of the water to conduct electric current[iv]. It refers to the number of ions present in water. Ions generally include chlorides, nitrates, phosphate, sulfates, calcium, magnesium, etc. Soluble bicarbonates, sulfates, and chlorides of calcium and magnesium are responsible for the hardness of the water.
Alkalinity refers to the capacity to resist acidic changes in pH. Simply, it is the capacity to neutralize the acid present in water. It is also known as buffering capacity. Note that alkaline is different from alkalinity. Calcium carbonate-rich water is said to have high alkalinity. Now hardness and alkalinity go hand in hand often. For example, when limestone and dolomite dissolve in water calcium or magnesium contribute to the hardness while carbonate causes alkalinity[vii].
Turbidity refers to the measure of how opaque or transparent the water is. It measures the intensity of scattered light by the material in the water when light is shined through the sample. The higher the intensity of scattered light, the higher the turbidity. Material that causes turbidity includes clay, silt, tiny inorganic and organic matter, algae, dissolved coloured organic compounds, plankton, and other microscopic organisms[viii].
While speaking about turbidity, one cannot neglect two terms TDS and TSS. TDS refers to Total dissolved solids. TSS stands for Total Suspended Solids. During the purification process, the particles that are large enough to be held back by the filter are called total suspended solids (TSS) while the particles that pass through the filter are called total dissolved solids (TDS)[ix]. Total dissolved solids (TDS) refer to the number of minerals, metals, organic material, and salts that are dissolved in a specific water volume. It is expressed in mg/L. It is directly related to the water quality in purification systems. Suspended forms can be molecular, ionized, or colloidal sol. Depending upon the nature, purification treatments vary[x]. The U.S. Environmental Protection Agency sets a secondary standard of 500 mg/L TDS in drinking water.
Reference: Kumar M, Puri A. A review of permissible limits of drinking water. Indian J Occup Environ Med 2012; 16:40-4.
Coliforms are bacteria that are always present in the digestive tracts of animals, including humans[xi].Escherichia coli (E. coli) is the major species in this group and is present in fecal matter. Some of the strains of coliforms cause dysentery and other kinds of infection related to the gastrointestinal tract. CPCB imposes no relaxation on the permissible limits to the presence of E. coli in drinking water.
Pollution case studies
Let us now focus on the various aspects of pollution of the Ganga River.
Tanneries:
Leather industries earn a special status in the Indian economy because they are the fourth largest foreign exchange earner with a share of around 7% of the total exports[xii]. The leather industry is dependent on the tanneries that unfortunately contribute to a significant amount of pollution in Ganga.
Let me give detail to explain how colossal the issue is. In order to process a kilo of leather, approximately thirty kilos of liquid effluent get discharged[xii]. Now, most of the tanneries are located in U.P; W.B and Bihar[xiii]. Besides other chemical and textile industries, Kanpur has around 151 tanneries located in a cluster at Jajmau along the southern bank of the Ganga with an estimated wastewater discharge of 5.8 to 8.8 million liters per day. Out of 151 tanneries in Jajmau, 62 tanneries use the chrome tanning process, 50 tanneries use vegetable tanning processes, and 38 tanneries use both chrome and vegetable tanning which bring about a plethora of other problems apart from the amount of generated waste[xii].
Numerous studies categorically point out that tannery wastes are one of the worst anthropogenic polluters. They principally contain Cr3+ ions which is a potent carcinogen. On the other hand, iron sulfates needed by the plants get reduced to iron sulfides and cause havoc in the riparian ecosystem by degrading the soil quality along the banks. Tannery effluents also have high protein content. Since they are biodegradable, they increase the oxygen demand of river water. Another example is Hydrogen sulfate. It adversely affects stream quality and causes bad taste and odor. Lastly, the effluent from the vegetable tannery is highly colored. When discharged into the stream, the color may persist for a very long period[xii].
Organic contaminants: Green revolution to the present day
In 2021, a review paper from Tarolli et. al having studied 61 publications over the past thirty years, found 261 individual organic compounds in Ganga[xiv]. The compounds were classified into three broad categories. First were emerging contaminants (EC); second pesticides and fungicides, and the third were industrial compounds.
Emerging contaminants are ‘‘Any synthetic or naturally occurring chemical or any microorganism that is not commonly monitored in the environment but has the potential to enter the environment and cause known or suspected adverse ecological and or human health effects’’[xiv]. They include pharmaceuticals, PCPs, caffeine, ASWs, parabens, phthalate plasticizers, benzotriazoles, bisphenol A, and PFAS.
Antibiotics are under the spotlight as EC because they can induce the development of antibiotic resistance in pathogenic bacteria. Non-steroidal anti-inflammatory drugs (NSAIDs) like diclofenac and ibuprofen and other drugs like paracetamol and carbamazepine are emerging as possible threats to aquatic ecosystems. NSAIDs are known for their toxicity on avian species, first reported in scavenger birds of the Indian sub-continent[xiv].
o PCPs are used as active substances or preservatives in cosmetics, body care products, surfactants, detergents, insect repellents, and sunscreen agents. They can interfere with the endocrine system and change the normal functioning of the aquatic bodies. Compounds called endocrine disruptors are steroids that can be present in the aquatic environment either due to natural excretion or as synthetic estrogens and progestogens used in animal husbandry and medical purposes. Notably, besides polypropylene copolymers (PPCP)s, bisphenol A an essential component of epoxy resins and plastic water bottles has been widely reported to exhibit endocrine-disrupting properties.
Artificial sweeteners (ASWs) are one of the most recently recognized classes of high-priority ECs among non-PPCPs. Most studied compounds are saccharine, cyclamate, acesulfame K, and sucralose[xiv].
Concerning pharmaceuticals, the compound with the highest water concentration was the antibiotic ampicillin (maximum recorded value, MRV: 27,100 ng/L, Delhi. For the NSAIDs, ibuprofen had the highest values (MRV: 2302 ng/L, Delhi. In the hormone group, the highest concentration was reported as androsterone[xiv].
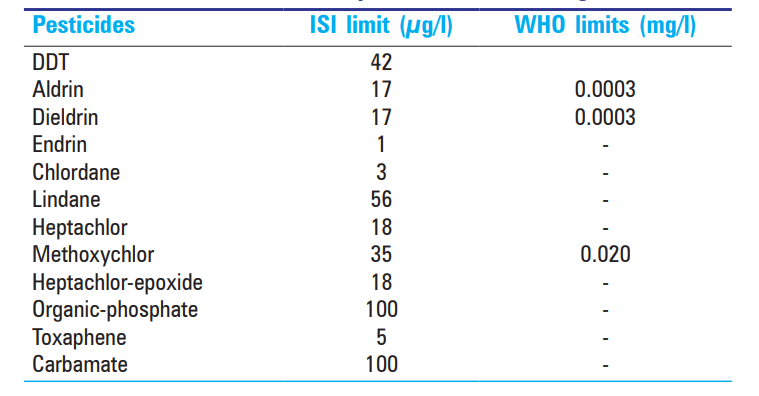
Pesticides resemble the most studied class of organic contaminants in the Ganga basin. They are the direct consequence of the Green Revolution in the 1970s.In India, pesticide consumption accounts for just 3.75 percent of worldwide use. 80 percent of the total pesticide use is represented by insecticides, 15 percent by herbicides, and 2 percent by fungicides.
Organochlorine pesticides (OCPs) are a class of insecticides and acaricides that include 9 of the first 12 contaminants listed in the Stockholm Convention on Persistent Organic Pollutants. Like all Persistent Organic Pollutants (POPs), OCPs such as DDT and lindane are characterized by high hydrophobicity, lipophilicity, and persistence in the environment and tend to bioaccumulate in the fatty tissues of biota, especially at high trophic levels. However, the use of DDT is still allowed in some regions of the world, including India, for applications against mosquitoes to control malaria. Similarly, lindane (g-hexachlorocyclohexane) can be employed for the control of body parasites (head lice and scabies).
Hexachlorobenzene (HCB) and several compounds belonging to DDT, HCH, endosulfan, heptachlor, chlordane, and cyclodiene groups are found in streams, ponds, and canals between Kanpur and Lucknow. Bishnu et al. studied the presence of heptachlor, dicofol, and endosulfan in water bodies adjacent to the tea gardens of Dooars and Hill regions, West Bengal; Singh Bhadouria et al. (2012) focused on compounds belonging to DDT, HCH, endosulfan, heptachlor, chlordane, and cyclodiene group, in the wetlands outside and inside Keoladeo National Park, Rajasthan; Rao and Wani (2015) investigated the presence of DDT, HCH, HCB, endosulfan, heptachlor, and cyclodiene pesticides in Tighra reservoir, near Gwalior.
For OCPs, the compounds with the highest concentration were a-HCH for water (MRV: 0.29 mg/L (290000 ng/L) at Lucknow (Jit et al., 2011)) and g-HCH for sediment (MRV: 7540 mg/kg d.w. at Bharatpur (Singh et al., 2012)).Among OPhs, the highest water concentration was found for malathion.
Industrial compounds comprise polychlorinated biphenyls (PCBs), polybrominated diphenyl ethers (PBDEs), organotin compounds (OTCs), and polycyclic aromatic hydrocarbons (PAHs). The concentrations of industrial chemicals in Ganga water and sediment exhibit a wide range of variability, from less than one to hundreds of ng/L and less than one to hundreds of mg/kg, respectively.
PAHs concentrations in some instances reach up to thousands of ng/L and mg/kg respectively with the highest concentrations of acenaphthylene in water (MRV: 65,850 ng/L, Lucknow and benzo anthracene in sediment (MRV: 5950 mg/kg d.w., Dehli. Kolkata is a contamination hotspot of PBDEs withsediment-associated total PAHs ranging from 50 mg/kg d.w. to more than 3000 mg/kg d.w. Surprisingly, high concentrations of total PAHs were detected in the Himalayan region of Nainital lakes, attributed to frequent forest fires and the use of coal and wood for heating and cooking purposes. This would appear to be a recent phenomenon as publications in the mid-1990s recorded very low PAH concentrations.
Cite this article as: Kumar M, Puri A. A review of permissible limits of drinking water. Indian J Occup Environ Med 2012; 16:40-4.
Heavy metal pollution
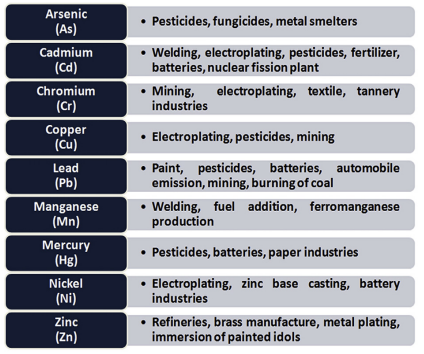
Heavy metals refer to the group of metals and metalloids which have an atomic density greater than 4 g/ cm3, or 5 times or more, greater than water.They are found in sediments due to the precipitation of their carbonates, hydroxides, and sulfides. The main culprits behind water pollution are Zn, As, Cu, Pb, Cd, Hg, Ni, and Cr. Now, Cu, Fe, Mn, Ni, and Zn are required as nutrients in trace amounts for life processes in plants and microorganisms but become toxic at higher concentrations. Others like Pb, Cr, and Cd are straightaway toxic elements and have no known biological function[xv].
Generally, metal industries, paints, pigment, varnishes, pulp and paper, tannery, distillery, rayon, cotton textiles, rubber, thermal power plant, steel plant, galvanization of iron products, and mining industries as well as unsystematic use of heavy metal-containing pesticides and fertilizer in agricultural fields discharge heavy metals in Ganga[xv].
Picture credit: D. Paul / Annals of Agrarian Science 15 (2017) 278e286
From 2006 to 2007, Bhattacharya et al. studied the accumulation of heavy metals in water, sediment, and tissues of different edible fishes in the Rishra-Konnagar region situated on the upper stretch of Gangetic West Bengal. According to them, the concentration of Zn, Cr, Cu, Cd, and Pb in sediment and water as well as in commercially edible fish samples at the sampling station exhibited a unique seasonal variation. The concentrations of heavy metals followed the trend: Zn > Cr > Cu > Cd > Pb. Kar et al. also analysed various heavy metals such as Fe, Mn, Zn, Cu, Cd, Cr, Pb, and Ni from the surface water samples of the river Ganga in West Bengal and found a significant seasonal variation for Fe, Mn, Cd, and Cr[xv]. Ansari et al. also studied the role of monsoon rain on concentrations and dispersion patterns of metal pollutants in sediments of the river Ganga in the Kanpur-Unnao industrial region and wrote that the monsoon rain reduces the contents of Co, Cr, Fe, and Ni, and enhances the contents of Cd, Sn, and Zn in sediments of the post-monsoon period.
Three ecologically distinct zones along the course of the river Ganga- Babughat, Diamond Harbour, and Gangasagar in West Bengal reported high values for Hg and Pb. It can be attributed to the discharge from pulp and paper manufacturing units and to atmospheric input and runoff from automobile emissions[xv].
Impact on Fishes
Studying the health of fishes in the context of pollution is crucial not only because they are good natural bioindicators of water pollution but also because they form a significant part of the Indian diet[xvi]. India ranks second in the world in inland fish production. West Bengal is the largest producer of inland fish and consumes 11.67 lakhs tons annually, the highest among all Indian states[xvii].
The ratio of proteins, lipids, and moisture in the fish tissue often determines its taste and nutritional value. It is well known that metals and other xenobiotics significantly increase the production of reactive oxygen species (ROS) leading to bio-oxidative stress. Consequently, tissue damage and several disorders of lipids, protein, and DNA metabolism occur in fishes[xvi].
Have you ever wondered why fish tastes bland in summers? It is mostly because fishes are not found healthy. Huma Vaseem and T.K Banerjee 2016, conducted a field study where they measured various biomarker enzymes and biochemical parameters in the various tissues like muscles, liver, gills, kidneys, brain, and skin of the Indian major carp Labeo rohita. The fishes were collected from different sites in Ganga flowing through the Varanasi district.They found out that the activities of antioxidant enzymes, e.g., superoxide dismutase, catalase, and level of lipid peroxidation were higher in the fish. It indicated pollutant-induced oxidative stress occurred in the fishes. Activities of other enzymes like aspartate amino transferase, alanine amino transferase, and alkaline phosphatase were also found in increased amounts. Some sites showed low moisture content in fish. It might be due to the disrupted osmoregulation caused by various toxicants accumulated in these fish[xvi].
Another study showed that Cr, Cu, Pb, and Zn levels were high in the fish samples from the middle stretch of Ganga while Hg was high in the estuarine samples[xviii]. Meanwhile, another paper from 2016 stated that in marketable-sized (approximately 500 gm in weight) Tenualosa ilisha, heavy metals accumulated as per the order Zn > Cu > Pb > Cd. However, they assured that the fishes are still fit for human consumption[xix].
Pollution in Ganga is also delicately threatening the overall balance of the aquatic ecosystem due to extinction of bio-invasion of certain species. Scientists noticed that various species of fish, which help in keeping the river water clean are facing extinction. In their place, numerous marine and exotic species like Sea Bass, Rostellascaris, Xenentodon Cancilla, Nile Tilapia, Clarius gariepinus, or Thai Magur are found in the freshwater of Ganga in Allahabad and its surrounding districts[xx].
Microplastics and more
It is not new to us how notorious plastics are. Rivers are one of the sources of plastic pollution. They carry more than 2 million tons of microplastics per year[xxi].Shockingly, the Ganges River system is considered the world’s second-largest plastic pollution contributing catchment after the Yangtze River in China[xxii]. It discharges 0.12 million tonnes of plastic per year.
Let me give stress on the issue of microplastics a bit. Microplastics are synthetic polymers ranging from 100 μm to 5 mm in size. They get directly or indirectly introduced to the environment through anthropogenic activities. They can be a fragment, fiber, pellet, film, bead, or foam form[xxi].
Primary microplastics are tiny plastic particles originating from facial cleansers and cosmetic preparation. Secondary microplastics are obtained from bigger plastic particles through physical, chemical, and microbial degradation processes.
A study in 2019 measured microplastic discharge from various sites along the bank of Ganga. Initially, Buxar, Bhagalpur, and Patna were selected for the study. They are highly populated areas. Nabadwip was studied owing to its high religious significance. Highly populated Barrackpore was also surveyed as it has numerous municipal sewage discharge points and thermal waste discharge points. Godakhali and Fraserganj though less dense and have a rural population witness intensive fishing activities[xxi].
The average meso and microplastic mass concentration in the sediment samples ranged from 0.68 to 148.31 ng/g (Mean ± SE ~ 52.88 ± 59.92 ng/g) and 11.48–63.79 ng/g (Mean ± SE ~37.56 ± 16.50 ng/g), respectively.The maximum contributors were Polyethylene terephthalate (PET) (39%) followed by polyethylene (PE) (30%). Polypropylene (PP) was found to contribute 19% of the total mesoplastics whereas the Polystyrene (PS) contribution was found to be very less (1%).
In short, the most common plastic types in the Ganga river sediments were PET, PE, and PP while the most important morphotypes were found to be fibers (polyesters) and sheet or film.These fibers in the Ganga sediment might have been coming from garment washing through effluents from municipal sewages.
The paper further commented,” The microplastic abundance in the Ganga sediments is highly correlated with available phosphate and specific conductivity of the sediments whereas it is more correlated with the BOD and available phosphate in water. A similar result was also found in the rivers of Japan, where it was stated that the microplastic abundance is highly correlated with an increase in BOD and phosphate content of water.”
Therefore, the plastic pollution in the Ganga has developed mostly in the polluted sites with poor water and sediment quality parameters. The source of meso and microplastics in the river Ganga is similar to that of other point sources of pollutants. However, the abundance of plastic particles in the near estuarine (Godakhali) and estuarine sites of the Ganga (Fraserganj) with less population density may be due to the accumulation of microplastics in the intertidal region and excessive use of fishing gear.
In 2019 some scientists zoomed into the composition of the pollution-causing polymers present in fishing gears. They not only investigated the distribution, and abundance of ALDFG on riverbanks but also explored what factors drove the waste drive environmental input[xxii]. Finally, they assessed the threat posed to air-breathing aquatic vertebrate species.
Regarding fishing gears, most of them were polymers.The most common polymer type was Nylon 6 (27.6%), polyethylene (22.4%), polypropylene (18.8%), poly(1,4-cyclohexanedimethylene terephthalate) or PCT (15.3%), high-density polyethylene (14.1%), polystyrene (1.2%) and polyethylene terephthalate (PET; 0.6%).
Sadly, the study revealed that many species were threatened due to abandoned fishing gear. Among the five amphibian species assessed the Indian bullfrog and marbled toad had the highest vulnerability score, followed by Jerdon’s bullfrog, Tytler’s pond frog, and Nepal Paa frog. Among the freshwater turtle species, the three-striped roofed turtle had the highest vulnerability score which was also the highest overall score of all species assessed, followed by the black spotted turtle, northern river terrapin, and red-crowned roofed turtle.Of the three crocodilian species assessed, marsh crocodiles had the highest vulnerability score, followed by gharial and saltwater crocodiles. One study reported the entanglement of a saltwater crocodile in ALDFG in Australia. Of the five bird species assessed, the black-bellied tern had the highest vulnerability score followed by the river tern, sarus crane, Indian skimmer, and river lapwing[xxii].
Mass bathing
As already mentioned, religious activities also augment the cause of pollution in Ganga. A very recent paper published in 2020 studied how mass bathing affected water quality during Maha-Kumbh in 2013[xxiii]. Apart from the regular water quality parameters, they studied microbial diversity and the role of bacteriophages in pollution.
Maha-Kumbh is held every 144 years at Prayag and is considered a very auspicious festival by the Hindus. At Prayag, Allahabad, Ganga, Yamuna, and the mythical Saraswati meet. Their confluence is called Sangam. Many people bathe at Sangam hoping to gain salvation.
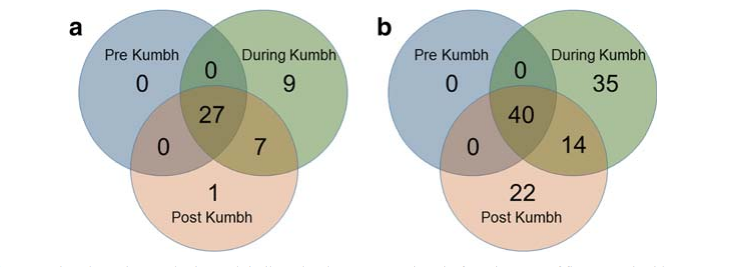
Ganga has a core microbial community structure comprising 40 bacterial species belonging to 27 genera. The core bacteria community ensures self-purification property to the river. Scientists observed that although the diversity of bacterial species increased by 1.5-fold, the core species did not vanish in both pre-Kumbh and post-Kumbh mass bathing events. During the bathing events, 88 bacterial species from 43 genera were observed. The dominant genera namely, Corynebacterium, Pseudomonas, and Vibrio present in pre-Kumbh Ganga water further increased during Kumbh. Besides, the species belonging to Brevibacterium, Burkholderia, Enterobacter, and Rhodococcus also increased during the Kumbh and post-Kumbh. Quantitatively, Escherichia coli presented the highest diversity index (0.883), followed by Enterobacter (0.718), Streptococcus faecalis (0.681), and Pseudomonas sp. (0.583).
Picture Credit: Environ Monit Assess (2020) 192: 221
The positive correlation between BOD, COD, level of ions, EC, TDS, hardness, and mass gathering indicated deteriorated water quality. An explanation is that people carelessly used soaps, shampoos, and detergents threw polythene and discarded clothes, as well as dumped food, flower, leaves, milk, curd, ghee, coins, etc., as an offering to the river Ganga.
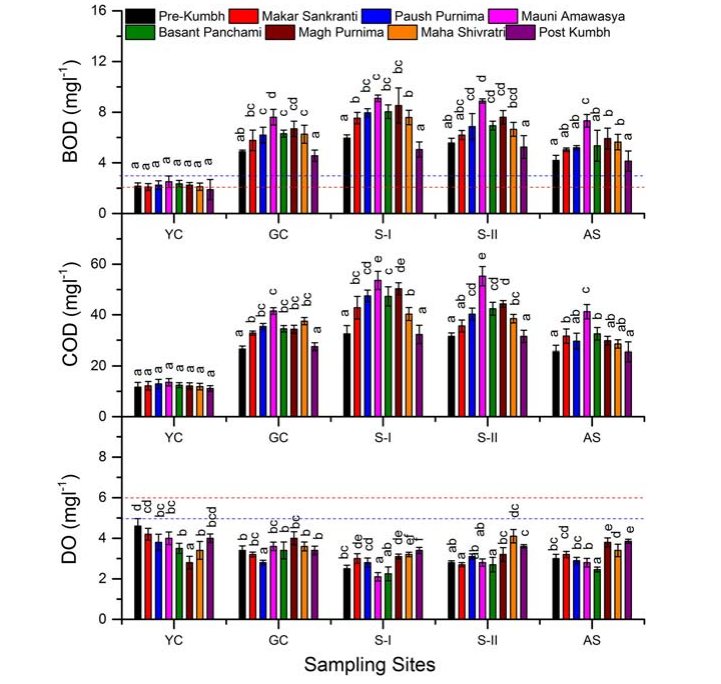
Picture credit: Environ Monit Assess (2020) 192: 221
The use of cleaning substances and desorption of Ca and Mg from sediment may increase the pH and alkalinity. The food and organic matter would cause an increase in BOD and COD and a reduction in DO.In all water samples, the level of trace elements was in the order of Fe > Zn > Mn > Cu > Co > Se and their level increased at bathing events chronologically up to Mauni Amavasya with the maximum level at the main bathing site i,e, Sangam.
Similar observations were also made during the Ganga Sagar Mela held in West Bengal near the Bay of Bengal[xxiv].
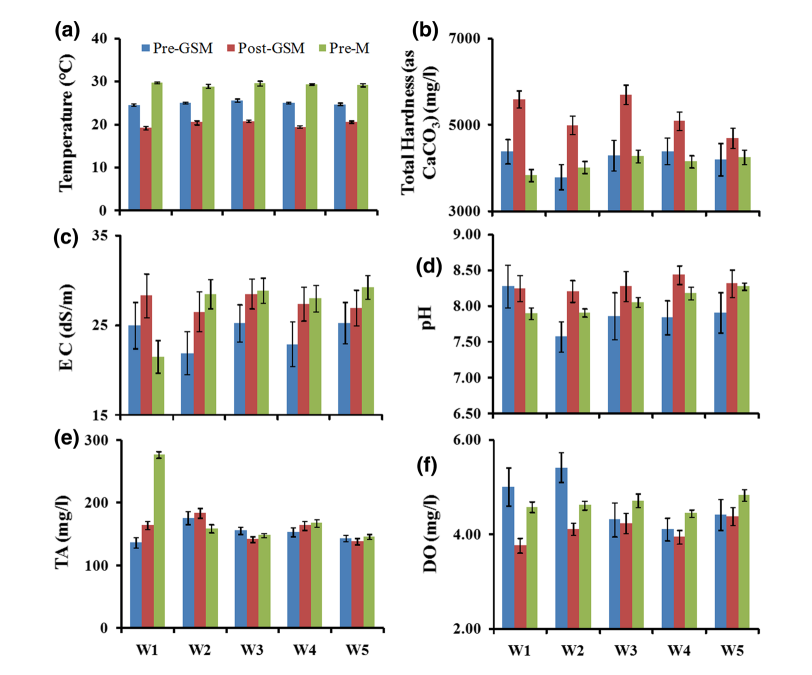
Picture Source: Environment, Development and Sustainability (2020) 22:1413–1430 https://doi.org/10.1007/s10668-018-0255-3
Author’s Bio:
Shrestha Chowdhury is currently working as a Senior Research Fellow in the Department of Chemical Sciences at IISER KOLKATA. For her fourth and her longest blog on the TQR platform, she has attempted to pen down her thoughts on our holy and beloved river the Ganga. This project was an eye-opening journey for her both in terms of scientific temperament and spiritual context. She earnestly wants the dire state of the river to be recovered into its glorious and pristine form. Hope the readers enjoy the write-up!
References
[i] https://doi.org/10.1016/j.ecolind.2020.107218
[ii] https://www.enr.gov.nt.ca/sites/enr/files/dissolved_oxygen.pdf
[iii] https://www.merusonline.com/bod-biological-oxygen-demand/#:~:text=Drinking%20water%20should%20have%20after,of%20around%2020%20mg%2Fl.
[iv] INTERNATIONAL JOURNAL OF ENERGY AND ENVIRONMENT Volume 1, Issue 5, 2010 pp.823-832
[v] https://scclmines.com/env/linkfile2.htm
[vi] https://www.healthline.com/health/ph-of-drinking-water#acceptable-ph-levels
[vii] https://extension.usu.edu/waterquality/learnaboutsurfacewater/propertiesofwater/alkalinity
[viii] https://www.usgs.gov/special-topics/water-science-school/science/turbidity-and-water#:~:text=Turbidity%20is%20the%20measure%20of,shined%20through%20the%20water%20sample.
[ix] https://datastream.org/en/guide/total-suspended-solids-and-total-dissolved-solids#:~:text=The%20particles%20that%20are%20large,total%20dissolved%20solids%20(TDS).
[x] https://www.corrosionpedia.com/definition/1103/total-dissolved-solids-tds
[xi] https://www.health.ny.gov/environmental/water/drinking/coliform_bacteria.htm#:~:text=Coliforms%20are%20bacteria%20that%20are,in%20plant%20and%20soil%20material.
[xii] ISPRS Journal of Photogrammetry & Remote Sensing 53 (1998) 204–216
[xiii] Environmental Monitoring and Assessment 68: 19–35, 2001.
[xiv] iScience 24, 102122, March 19, 2021 ª 2021 The Author(s). This is an open access article under the CC BY license (http://creativecommons.org/licenses/by/4.0/).
https://doi.org/10.1016/j.isci. 2021.102122
[xv] D. Paul / Annals of Agrarian Science 15 (2017) 278e286
http://dx.doi.org/10.1016/j.aasci.2017.04.001
[xvi] Environ Monit Assess (2016) 188: 444 DOI 10.1007/s10661-016-5433-x
[xvii] Environ Monit Assess (2009) 157:97–104 DOI 10.1007/s10661-008-0518-9
[xviii] Aquatic Ecosystem Health & Management, 16(4):454–464, 2013. DOI: 10.1080/14634988.2013.858587
[xxix] IJISET – International Journal of Innovative Science, Engineering & Technology, Vol. 3 Issue 4, April 2016.
[xx] Bioved, MITALI DHIMAN et al. 229 25(2): 229–242, 2014
[xxi] Science of the Total Environment 694 (2019) 133712
https://doi.org/10.1016/j.scitotenv.2019.133712
[xxii] Science of the Total Environment 756 (2021) 143305
[xxiii] Environ Monit Assess (2020) 192: 221 https://doi.org/10.1007/s10661-020-8152-2
[xxiv] Environment, Development and Sustainability (2020) 22:1413–1430 https://doi.org/10.1007/s10668-018-0255-3